Airline Yield Management: Why the Passenger Next to You Paid Less
Introduction: The Paradox of Seats 14B and 14C
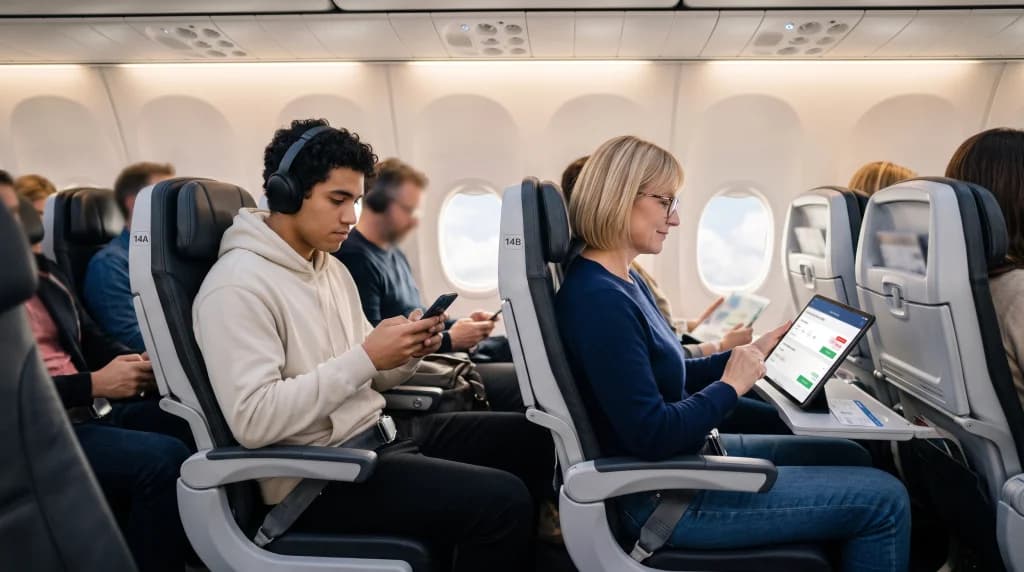
Imagine a typical commercial flight from London to Lisbon or from Frankfurt to New York. You are settled into seat 14B aboard an Airbus A321neo. To your right, in aisle seat 14C, sits a fellow traveler sipping the exact same coffee, looking at the same cloud deck, and arriving at the destination runway at the very same split second as you. A mere few inches of armrest space separates your seats, yet financially you are worlds apart: you paid $450 for your ticket, booking it just three days before departure to attend an urgent business meeting, while your neighbor paid barely $85, having clicked "Book Now" on a quiet Tuesday evening four months prior.
Many travelers view this disparity as an arbitrary injustice, pure disorder, or unvarnished corporate greed. In truth, an airline seat is the most perishable commodity on the planet. The second the cabin doors latch and the jet bridge pulls away from the fuselage, the economic inventory value of every unoccupied seat plummets to absolute zero. It cannot be shelved in a warehouse, discounted for an end-of-season clearance rack, or auctioned off next week. Because of this zero-salvage-value reality, commercial aviation pioneered one of the most sophisticated, mathematically rigorous apparatuses of modern commerce: Yield Management and dynamic Revenue Management algorithms.
No human fare manager sits behind a desk dictating what you pay for an itinerary. Every millisecond of your booking journey is evaluated by self-tuning stochastic models, demand curves, historical booking records spanning decades, and behavioral market analyses. How does this digital pricing engine operate, and why did the passenger next to you pay a fraction of your fare?
Origins and Foundations: How Robert Crandall Transformed Commercial Aviation
To grasp the mechanics of modern airline ticket pricing, one must look back to 1978 and the passage of the Airline Deregulation Act in the United States. Prior to deregulation, commercial aviation operated under rigid federal oversight: routes were allocated through administrative hearings, and fares were dictated by standardized cost-plus regulatory formulas. Flying was a luxury reserved for the affluent, and aircraft frequently operated with half-empty cabins.
Market deregulation unleashed unrestricted competition, paving the way for low-cost, no-frills disruptors like People Express. Established legacy network carriers, burdened by substantial pension obligations, expansive multi-type fleets, and collective bargaining agreements, faced existential financial threats. At that juncture, Robert Crandall, then president of American Airlines, recognized a pivotal commercial principle: a full-service legacy carrier could not survive by slashing fares across every seat on an aircraft, but it could dominate by selling a select block of seats below the discounter's unit cost while selling the remaining seats to time-sensitive business travelers for a substantial premium.
This insight led to the creation of DINAMO (Dynamic Inventory Optimization and Maintenance Optimizer), laying the groundwork for modern Yield Management. Crandall linked the global inventory capabilities of the SABRE computer reservations network with predictive mathematical modeling, demonstrating that variable pricing based on purchase timing and consumer segment profiles could capture hundreds of millions of dollars in incremental revenue. Donald Burr, founder of People Express, later reflected on the collapse of his carrier: "We were a profitable company from 1981 to 1985... Then American came along with DINAMO and dumped huge numbers of cheap seats in our markets... It was all over."
Booking Classes and Fare Buckets: The Hidden Alphabet of the Cabin
To a traveler stepping on board, an airliner cabin is partitioned into physical classes: Economy, Premium Economy, Business, and First Class. Within an airline's central reservation engine, however, that physical space is mapped into dozens of virtual segments designated by single letters of the alphabet: Booking Classes (commonly known as Fare Buckets).
On a typical 180-seat single-aisle flight, the economy cabin is not sold as a single, uniform product. Instead, the inventory is distributed across a tiered series of nested inventory buckets:
- Y and B Classes: Full-fare, unrestricted economy. These tickets offer maximum flexibility, penalty-free schedule changes, and full refundability. Priced at the top of the economy scale, they target corporate travelers booking at the eleventh hour.
- M, H, and Q Classes: Mid-tier economy inventory. These fares carry semi-flexible rules, modest rebooking penalties, and partial refund limitations.
- V, W, T, L, and K Classes: Deep-discount promotional buckets. These represent the lowest cash fares, featuring absolute non-refundability, steep rebooking penalties, no complimentary advance seat selection, and minimal frequent flyer mileage accrual.
When you query an online travel agency or an airline website, the platform does not calculate a price from first principles. The revenue management algorithm checks which fare bucket is currently opened for that route and departure date. If a flight was allocated 15 seats in deep-discount bucket K at $40, the instant the fifteenth passenger confirms their reservation, bucket K locks shut. A sixteenth passenger querying the exact same seat thirty seconds later is served inventory from bucket L, priced at $75.
Demand Curves and Dynamic Booking Profiles (Pickup Models)
At the center of contemporary inventory optimization platforms (such as Amadeus Altéa Revenue Management, PROS, and Sabre AirVision) lie Booking Curves (Pickup Models). Every route, split by day of the week, departure time, and season, is governed by an empirical mathematical model outlining the expected pace of seat absorption over a 330-day selling window leading up to departure.
1. Business vs. Leisure Route Dynamics
Consider a 07:00 Monday morning departure from London Heathrow to Frankfurt. Fleet historical data shows that tourists rarely book this sector. Up to 85% of the cabin consists of financial executives, legal counsel, and corporate managers. The pricing algorithm knows these corporate travelers do not plan their journeys four months in advance; their itineraries stem from sudden client requirements and are billed to corporate expense accounts characterized by highly inelastic price elasticity of demand. Opening low-yield promotional fare buckets on this flight months early would represent a commercial misstep—those seats would simply be consumed by travelers willing to pay higher fares later. The algorithm accordingly restricts discount inventory and holds capacity for the final 14-day booking window, capturing premium yields.
In contrast, observe a Saturday morning service from Manchester to Palma de Mallorca in mid-July. This profile is entirely leisure-driven. Vacationers plan their holidays two to six months out, and their price sensitivity is high—a modest $30 fare increase may drive them to choose alternative destinations like Greece or mainland Spain. The algorithm responds by releasing a wide pool of discounted fare buckets 90 to 120 days out to establish a robust baseline Load Factor, only tightening inventory when seat availability becomes scarce.
2. Dynamic Inventory Adjustments
Revenue management engines continuously benchmark current seat absorption velocity against expected historical pickup curves. Suppose that 40 days prior to a scheduled flight, the model forecasts that 45% of cabin capacity should be booked:
- Scenario A (Above-Target Pickup): If actual bookings hit 65% of capacity, the algorithm identifies higher-than-anticipated demand. It immediately closes the lower-tier fare buckets and ratchets pricing up two buckets. Capitalizing on strong demand allows the carrier to maximize yield per available seat.
- Scenario B (Below-Target Pickup): If actual bookings stand at only 25%, the algorithm flags a demand deficit. To mitigate the risk of departing with empty capacity, the system triggers a fare bucket reopening, releasing seats back into lower fare categories to stimulate booking velocity. This dynamic adjustment creates the fare drops that seasoned travelers occasionally find weeks before departure.
Core Airline Operating Metrics: CASM, RASM, and the Spoilage Dilemma
To understand algorithmic pricing decisions, one must step away from evaluating single ticket prices and look at the aggregate financial metrics tracked in airline operations:
1. CASM / CASK (Cost per Available Seat Kilometer/Mile)
The baseline unit operating cost to fly one available seat over a distance of one kilometer or mile. Calculated by dividing total operating expenditures (fuel, aircraft leasing, flight crew payroll, air navigation charges, fleet depreciation, and ground handling) by total available seat-kilometers. CASM represents the structural floor that an airline's network revenue must clear to maintain operating profitability.
2. RASM / RASK (Revenue per Available Seat Kilometer/Mile)
The total operating revenue generated per available seat over one kilometer or mile. An airline's operating margin is defined by the spread between RASK and CASK. Crucially, a carrier can intentionally price 20% of its seats well below its break-even CASK, provided the remaining 80% of the cabin generates sufficient RASK to ensure the total flight sector operates profitably.
3. Spoilage vs. Spill: The Core Optimization Trade-Off
Every commercial airline pricing engine continuously balances between two competing revenue risks:
- Spoilage: The flight departs with 15 unoccupied seats because the algorithm maintained an elevated fare threshold of $400 until departure, anticipating last-minute corporate travelers who never materialized. Those 15 empty seats represent lost revenue. Had the inventory system released them at $100 six hours before departure, the flight would have captured an additional $1,500 in marginal contribution.
- Spill: The carrier panicked, releasing all available seats three weeks prior to departure at $80. The aircraft operates at a 100% load factor, but two days before departure, twenty business travelers sought seats at $500 each. With the cabin fully booked, that high-yield revenue was turned away ("spilled") to competitors, resulting in a substantial opportunity cost.
The primary task of automated revenue management models is finding the optimal equilibrium point where the combined financial impact of spoilage and spill is minimized.
The Mechanics of Overbooking: The Mathematics of No-Shows
One of the most consequential applications of yield management modeling is deliberate flight overbooking. Airlines operate on the reality that a confirmed reservation does not guarantee an embarked passenger. The No-Show phenomenon is an operational constant across commercial aviation, driven by missed connections, highway congestion, delayed surface transit, business cancellations, and personal emergencies.
Rather than absorbing no-shows as lost revenue, carriers apply binomial distributions and Poisson probability models. Drawing on years of route-level operational data (such as a 17:30 Friday departure from Chicago O'Hare to New York LaGuardia), pricing models project no-show probabilities with statistical consistency—for example, forecasting a 6.2% no-show rate with a standard deviation of 1.1%.
On an aircraft configured for 180 seats, the reservation system may deliberately accept 189 confirmed passenger bookings. The statistical probability of all 189 passengers checking in and presenting themselves at the gate is extremely low. In the vast majority of departures, exactly 177 to 180 travelers show up, allowing the airline to monetize capacity that would have otherwise flown empty.
In the rare event that statistical variances align and 185 passengers arrive for 180 seats, airlines deploy denied-boarding procedures governed by statutory consumer frameworks such as EU261/2004 or US DOT regulations. From an actuarial standpoint, issuing $450 in statutory denied-boarding compensation alongside hotel vouchers to five displaced passengers is comfortably offset by the recurring revenues generated across thousands of systematically overbooked flights across the network.
The Incognito Mode Myth vs. Modern Dynamic Personalization
A persistent travel myth suggests that "searching for a flight multiple times causes the airline to track your browser cookies and artificially raise the fare to force an immediate purchase." From a software engineering perspective, the reality of airline distribution architecture paints a different picture.
1. Global Distribution System (GDS) Architecture vs. Browser Cookies
Most traditional network carriers process flight queries through Global Distribution Systems (GDS) like Amadeus, Sabre, or Travelport. Every pricing query incurs micro-infrastructure look-up fees for the carrier. High-volume booking engines are tuned to optimize database transaction queries, cached availability tables, and API response times, not to track individual browser sessions to manipulate fares dynamically. When a price increases between searches, it is typically caused by two structural factors:
- Another user (or an aggregator scraping tool like Kayak or Google Flights) temporarily placed a payment hold on the final available seat in a lower fare bucket during an active checkout session.
- The revenue management engine executed a scheduled batch-recalculation, closing lower buckets based on broader market demand rather than your personal search activity.
2. The IATA NDC Standard and Continuous Pricing
While the cookie myth has historically been unfounded, the commercial environment is evolving with the adoption of NDC (New Distribution Capability) messaging standards developed by IATA. Traditional legacy distribution forced airlines into 26 rigid alphabetical fare buckets. NDC removes these constraints by establishing direct XML/JSON data links between the customer's interface and the carrier’s offer-creation engines.
Through NDC architecture, airlines are deploying Continuous Pricing and algorithmic personalization. Instead of static bucket steps, fares can be calculated along a dynamic curve based on broader context:
- Frequent Flyer Data: High-tier corporate travelers booking on corporate accounts face different willingness-to-pay calculations than price-sensitive leisure flyers.
- Point of Origin: An itinerary originating in London may price differently than the same itinerary priced in emerging regional markets, reflecting varying purchasing power parity.
- Shopping Basket Context: Pricing engines recognize whether an inquiry involves a solo business traveler or a family booking four seats together, enabling subtle adjustments in how ancillary options—such as seat reservations and checked baggage—are bundled and priced.
Ancillary Revenue: The Battle for Operating Margins
Yield management extends well beyond the base airfare. For low-cost carriers (such as Ryanair, Wizz Air, and easyJet), the base ticket often serves as a loss leader, designed to secure the passenger's business before monetizing the journey through non-ticket products.
Profit optimization is heavily concentrated in Ancillary Revenues, where dynamic pricing algorithms operate continuously:
- Assigned Seating: Fees for extra-legroom seats or exit rows fluctuate based on flight duration, passenger loads, and time remaining until departure. If front-cabin seats remain unsold close to departure, pricing algorithms will often lower selection fees to capture incremental revenue before the check-in window shuts.
- Cabin and Checked Baggage: Overhead bin space is physically finite (typically accommodating roughly 90 to 100 roll-aboard bags on an aircraft seating 189 passengers). Carriers use dynamic pricing to balance demand against available space, increasing carry-on bag fees as available overhead capacity declines.
- Random Seat Allocation Mechanics: Low-cost booking engines frequently use automated seating algorithms that separate travelers on the same confirmation code across different rows when they opt for free random seat allocation. This design leverages behavioral economics: introducing the friction of separation encourages travelers to pay for seat selection on subsequent bookings.
Understanding the Pricing Equation
When you take your seat on an airliner and look across the aisle, you are not simply viewing fellow shoppers who bought a commodity off a store shelf. You are sharing a cabin with participants in an intricate, continuous global auction, governed by algorithms calculating demand curves and probabilities in fractions of a second.
The traveler to your left secured a lower fare by providing the airline with advance revenue stability, purchasing their ticket while the carrier was establishing baseline occupancy. The passenger to your right paid a premium because the airline took the commercial risk of flying with empty capacity to hold that seat until the last minute, anticipating a high-yield booking from a traveler whose schedule required an immediate departure.
Seen through the lens of Yield Management, airline pricing reflects the interplay of capacity constraints, passenger demand, and time. In commercial aviation, the price of a ticket is not determined by distance flown or cabin space occupied, but by the value of a seat that ceases to exist the moment the aircraft takes to the sky.